Create a data pipeline
Let's get started by creating a simple data pipeline. They say that anything complex is made up of simple parts, so use these basic building blocks to go on and conquer the data world with more complex data pipelines.
We will follow these steps:
- Create a data pipeline
- Choose a trigger
- Add processors
- Test run your pipeline
- Write python code inside a processor
- Update the python packages
- Write python code
- Test the code
- Run the pipeline
Create a data pipeline
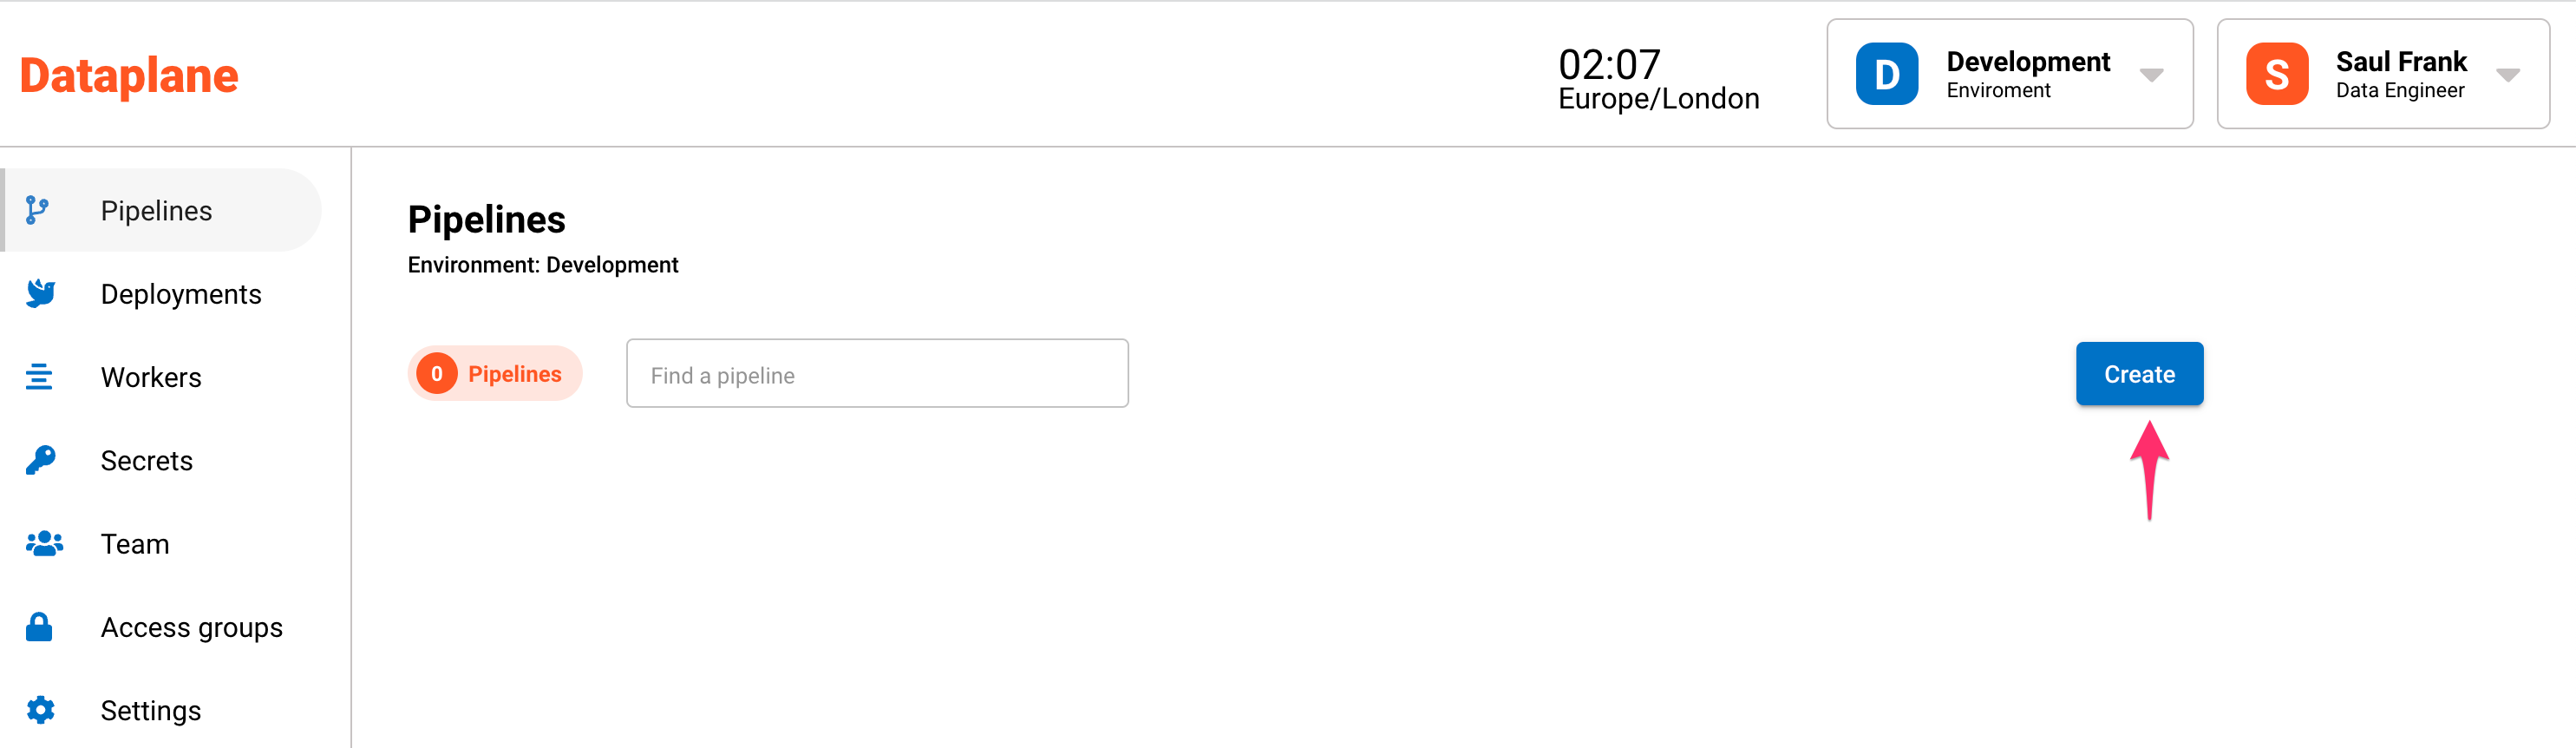
Go to Pipelines and click the Create button.
A sidebar will open up and will ask for a name, description and worker group.
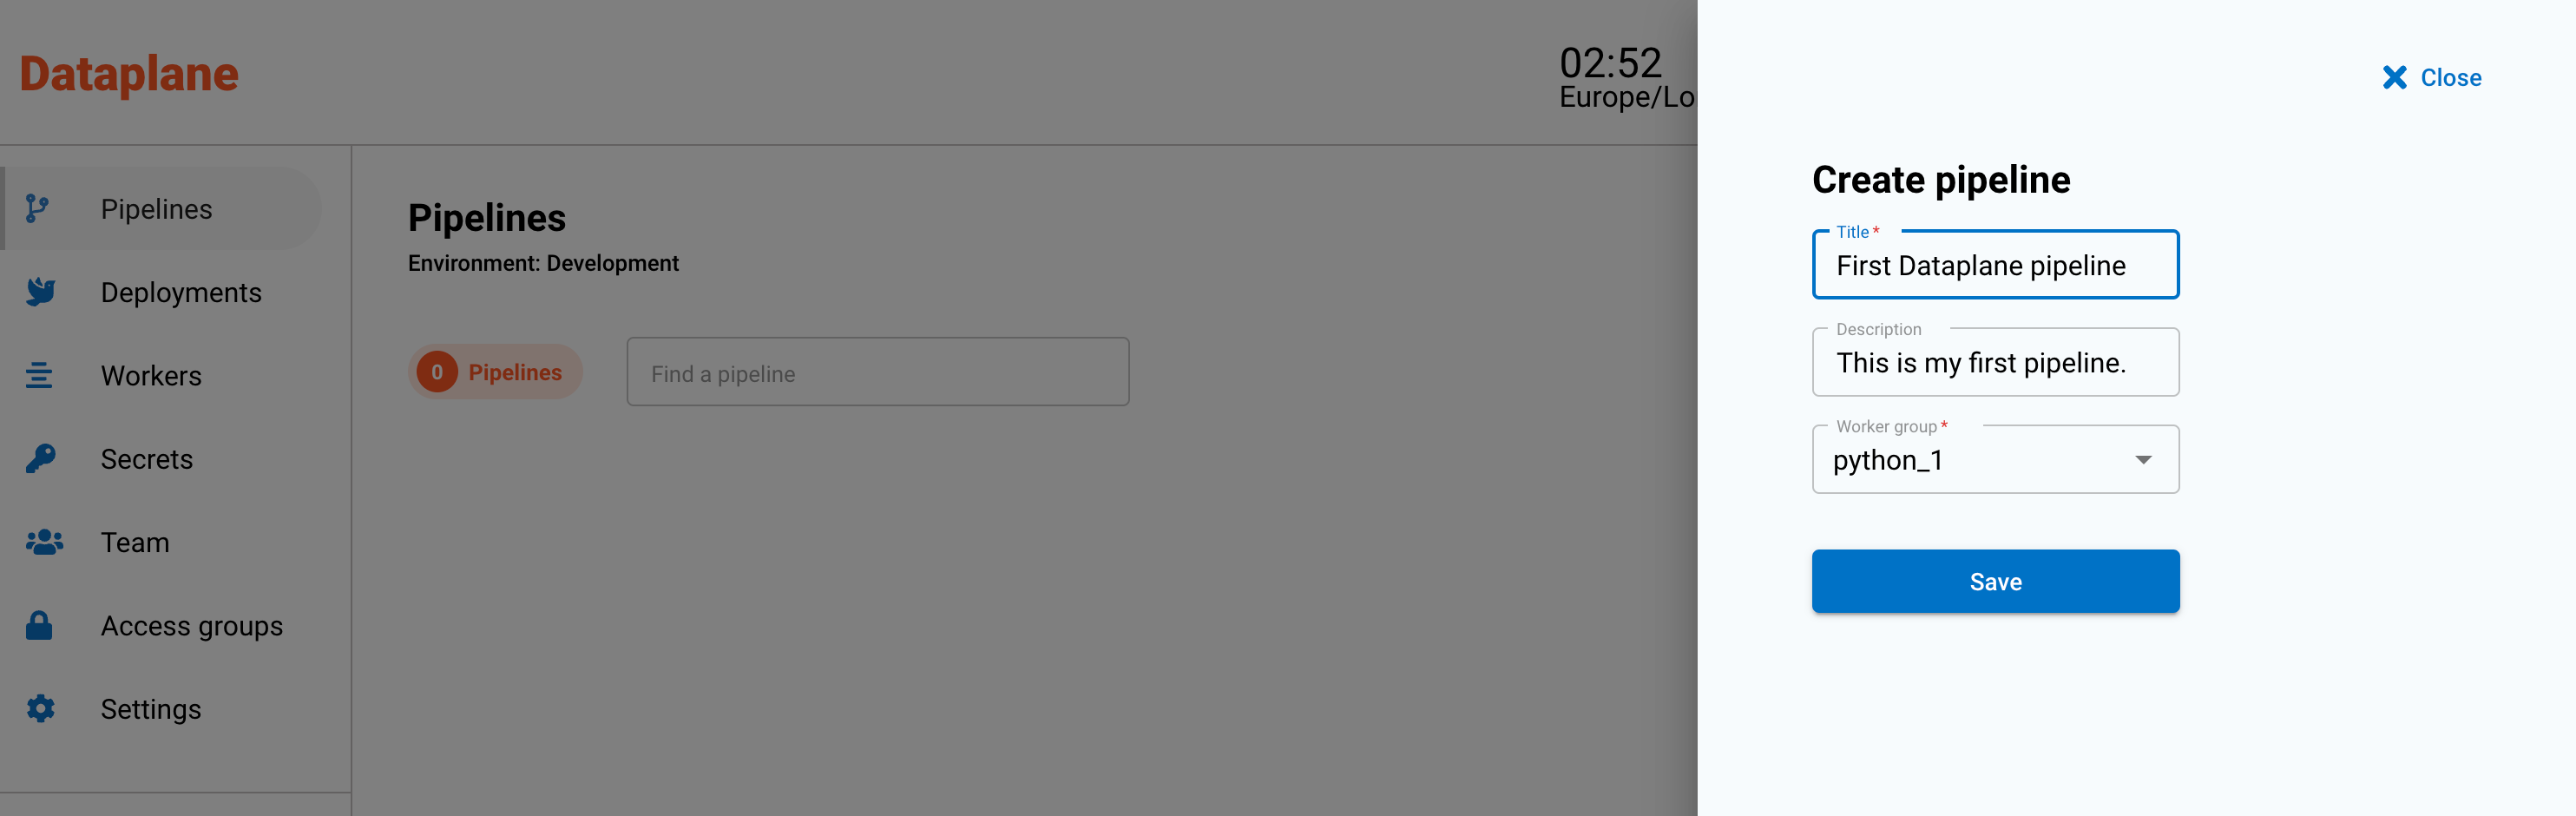
A worker group is a group of servers (workers) that will run the code. Workers run as separate servers and can be configured to scale with your analytical workloads.
Choose a trigger
The most basic of triggers is the play trigger. The play trigger starts a pipeline when the Run button is pressed.
Drag the play trigger onto the canvas as the first component of your data pipeline.
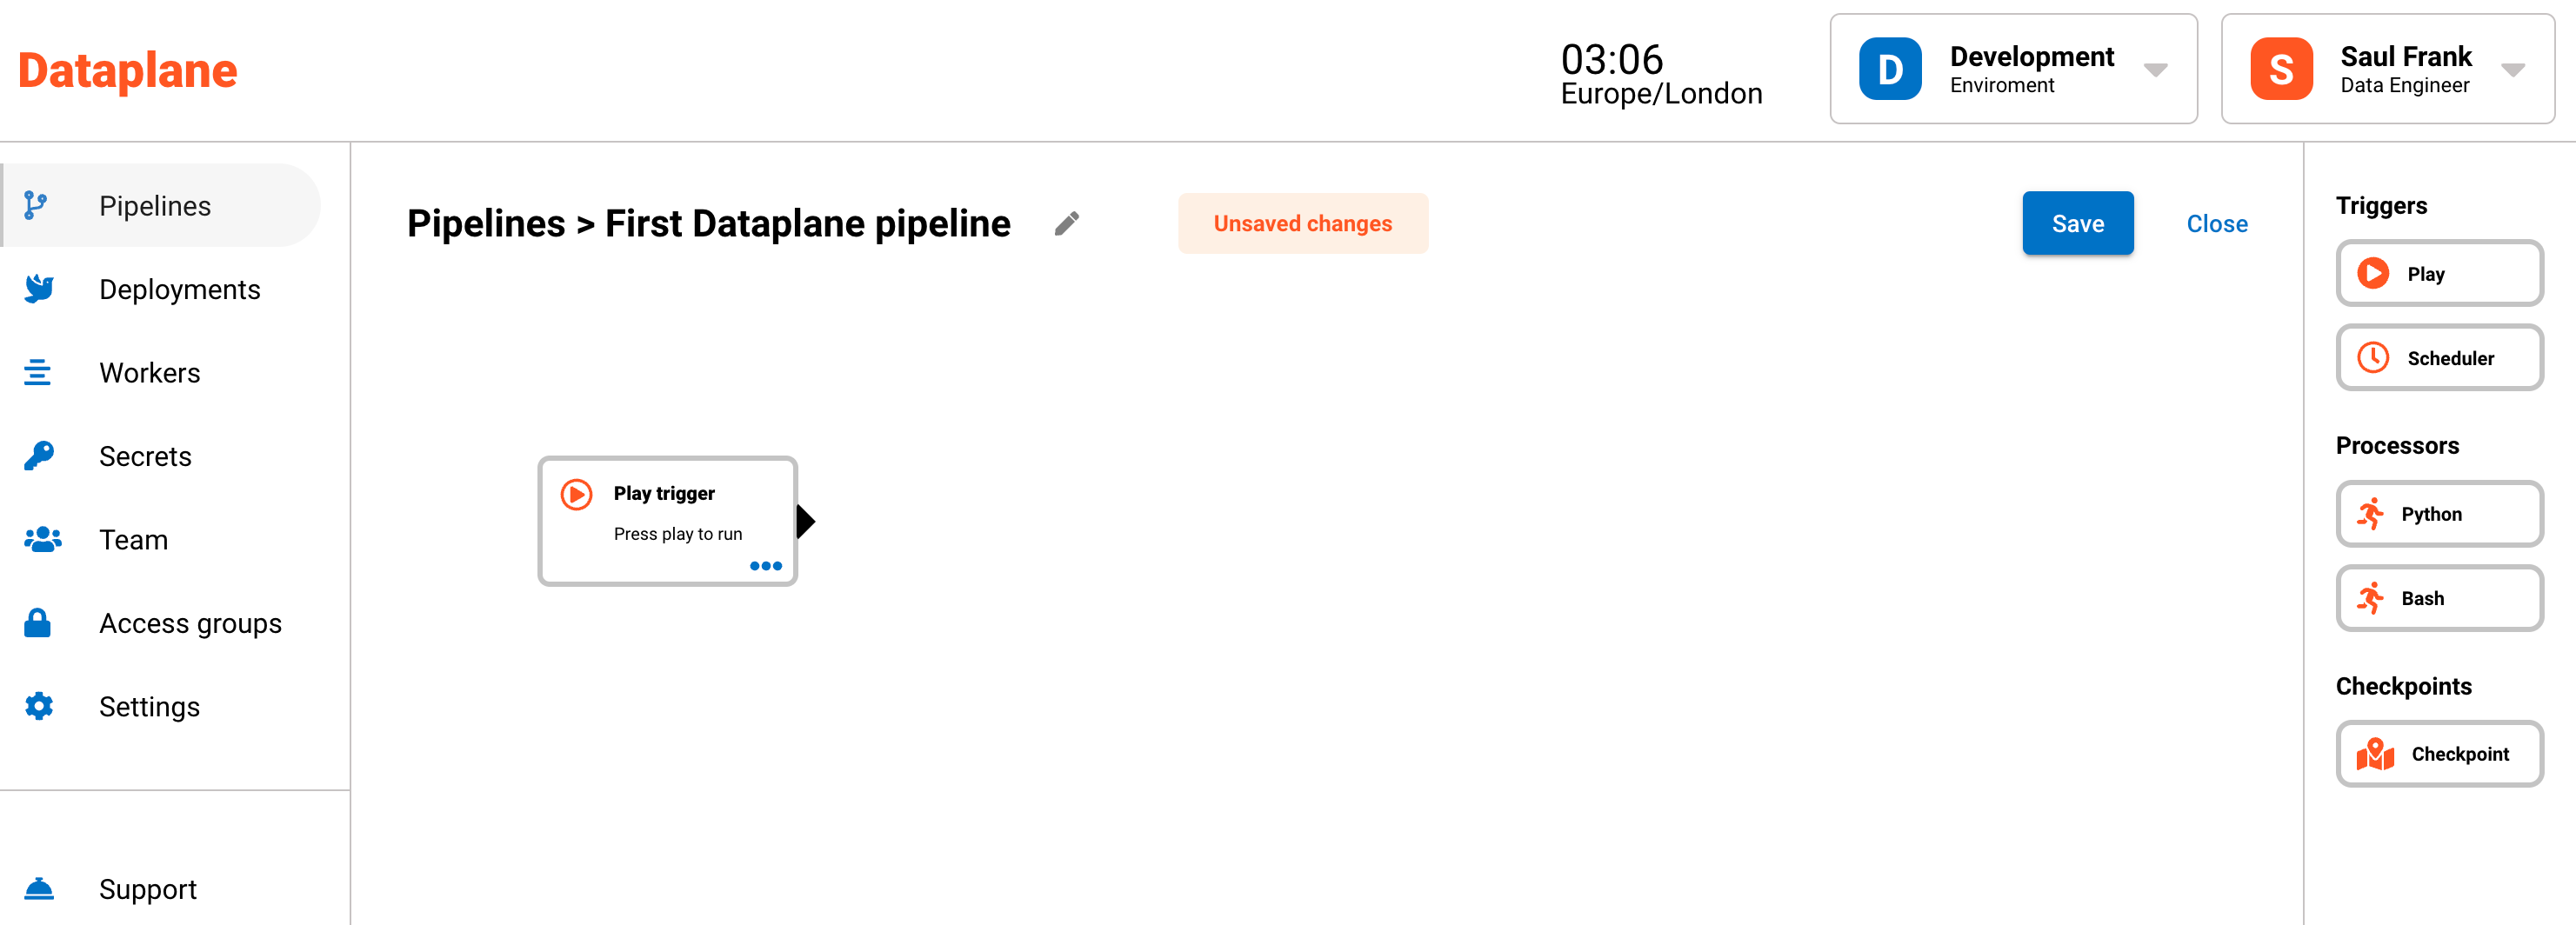
A trigger is the first step in a data pipeline and, it's the "trigger" that fires off the pipeline to run. There are different types of triggers that can start a pipeline. For example, the scheduler trigger will fire off based on a regular schedule such as every hour or at 8am every Monday.
Add processors
For each processor or step in your pipeline, you can write code that connects, transforms or distributes your data. The worker group or workers is the cluster of servers that run the processors.
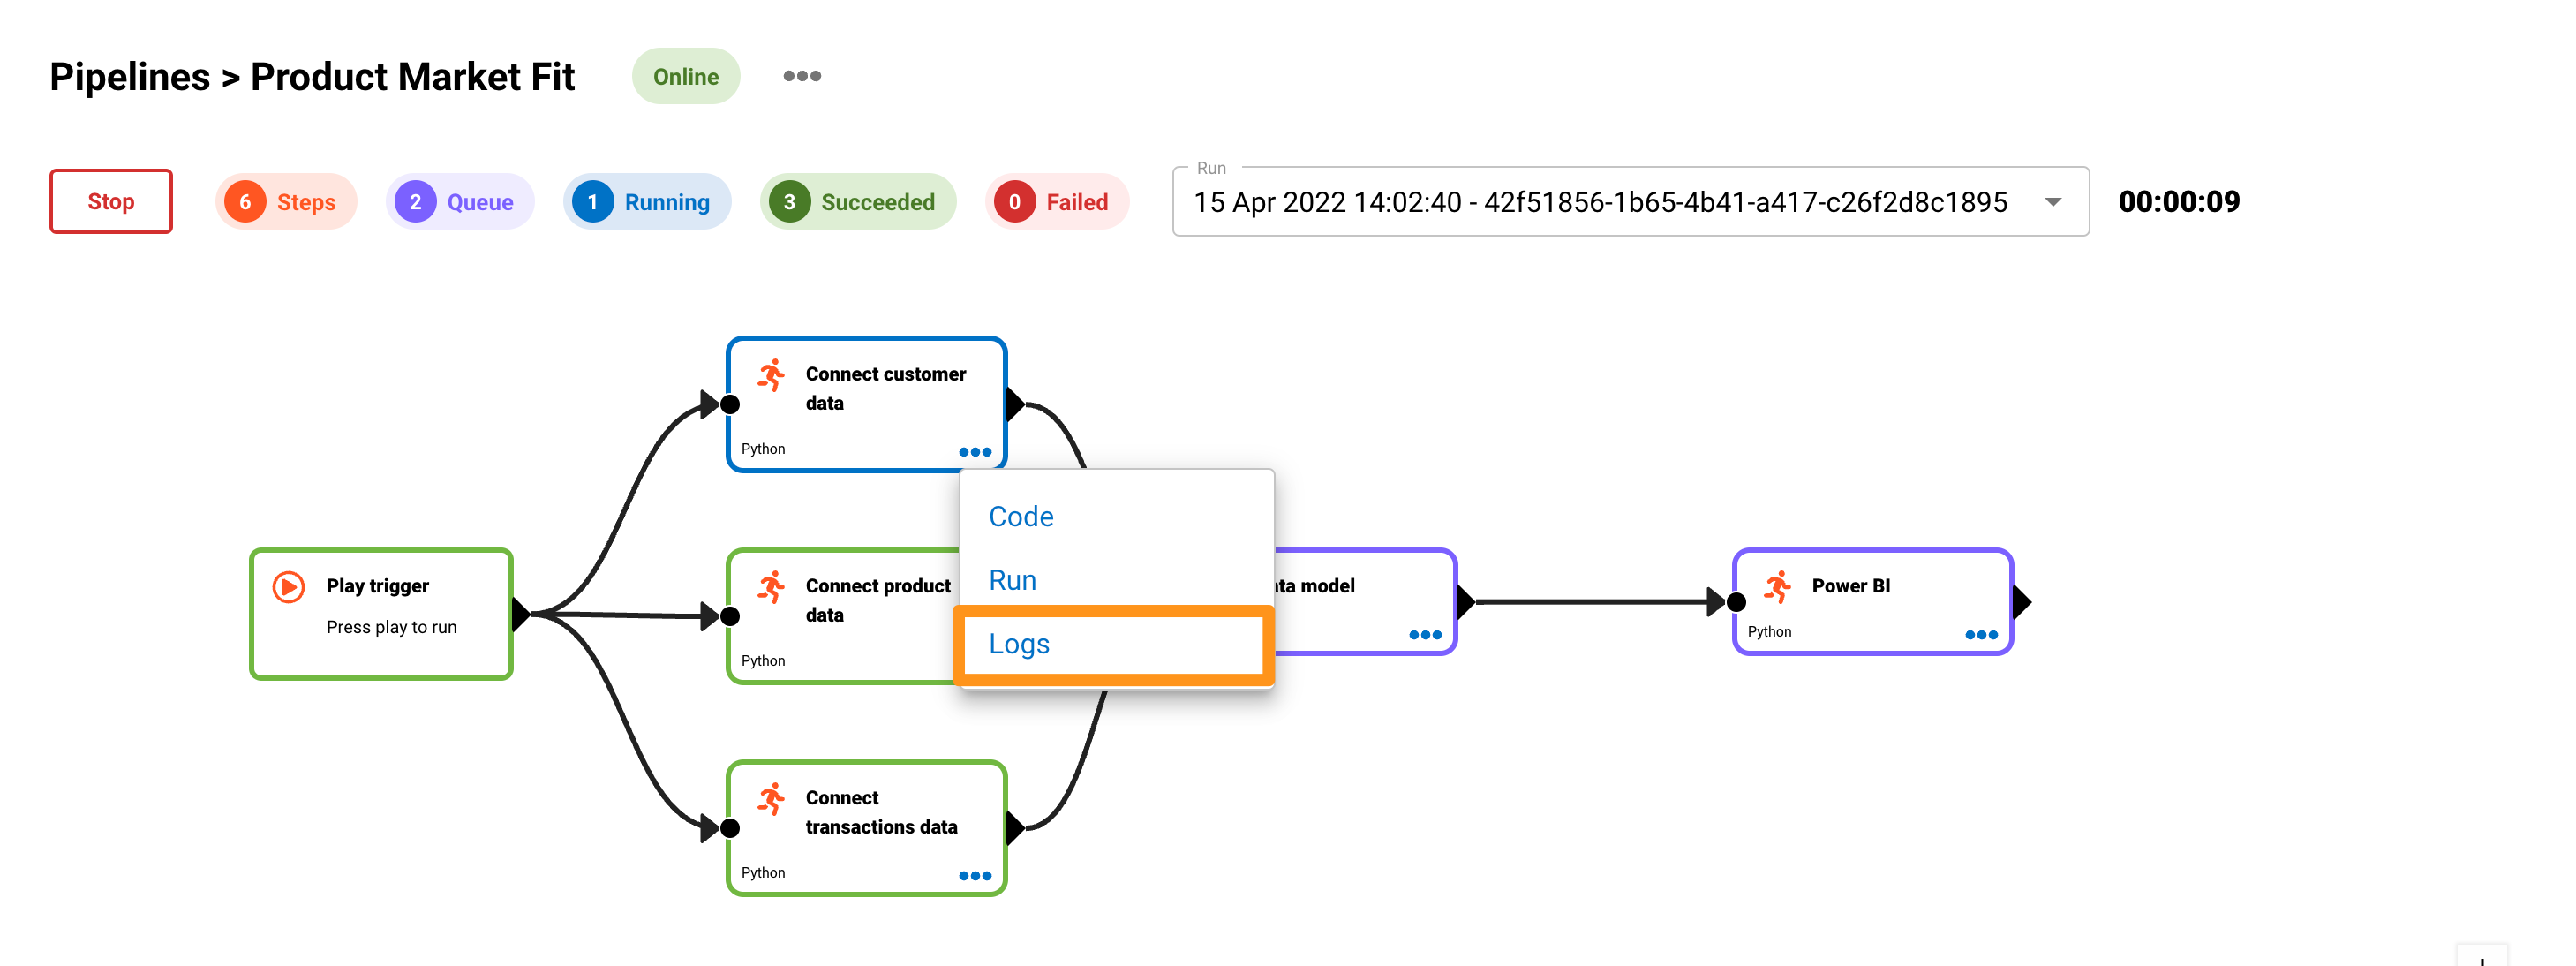
Try creating a pipeline similar to the recording below:
- Drag and drop python processors to construct your data pipeline.
- Use the connector arrows to join each step.
- Save the pipeline by pressing the Save button in the top right hand corner.
The below image shows that you can design processors in your pipeline to run sequentially or in parallel.
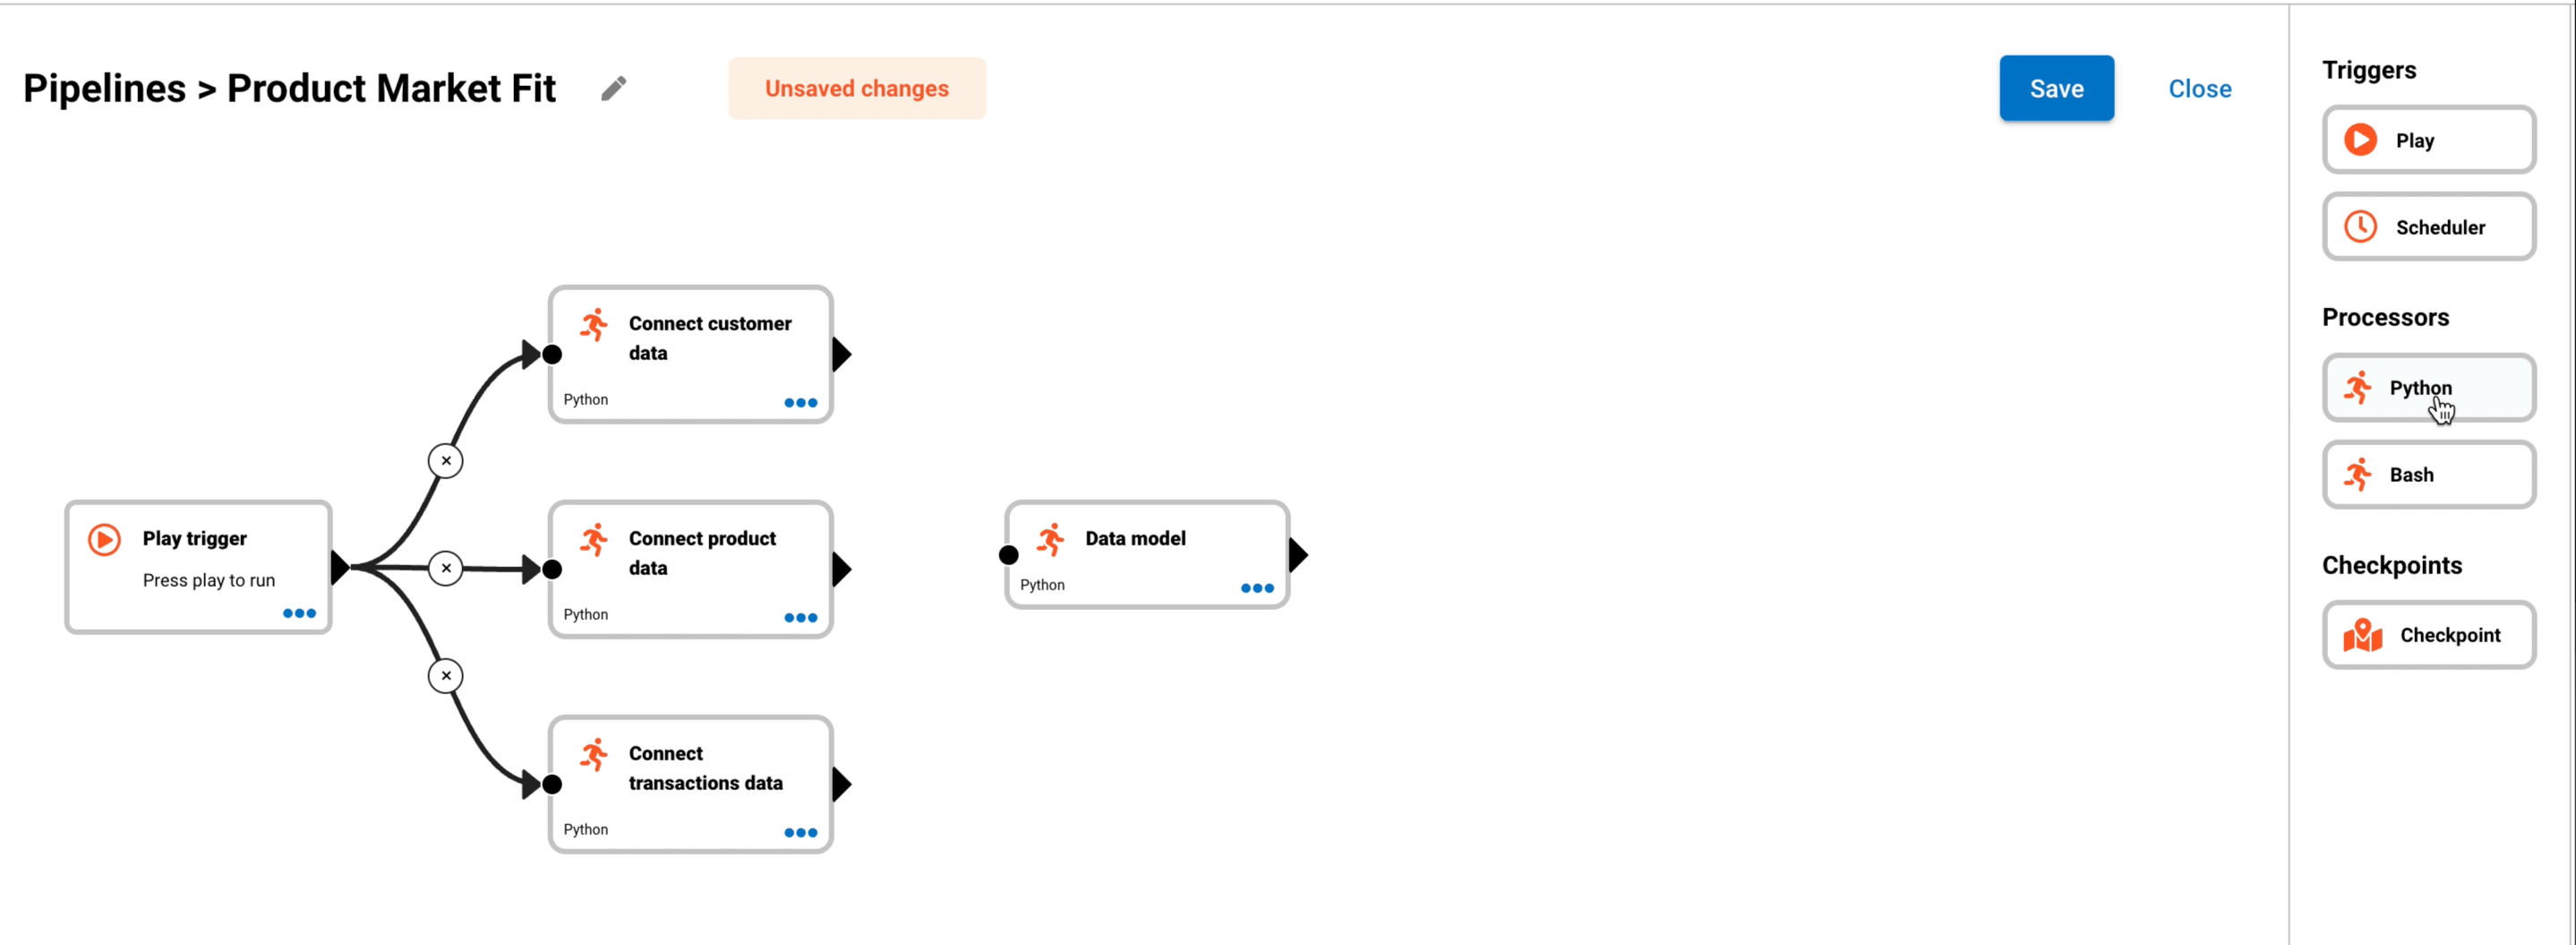
- The Play button is the trigger that will run the pipeline.
- Connect customer data, Connect product data and Connect transaction data will run in parallel.
- Once the three connect data steps has completed, the Data model step will start.
- The final step is the visualisation or distribution step. This will run once point 3 has been completed.
Test run your data pipeline
To test your pipeline, press the Run button. Each step will go through the following cycle:
- Queue (Purple) - in the queue or planned to run
- Running (Blue) - currently running
- Succeeded (Green) - completed successfully
- Failed (Red) - an error occurred or pipeline stopped
To see the real-time run logs, click on the three dots on one of the processors and click Logs.
Open the code editor
To open the code editor, click on the three dots on the processor and click on Code.
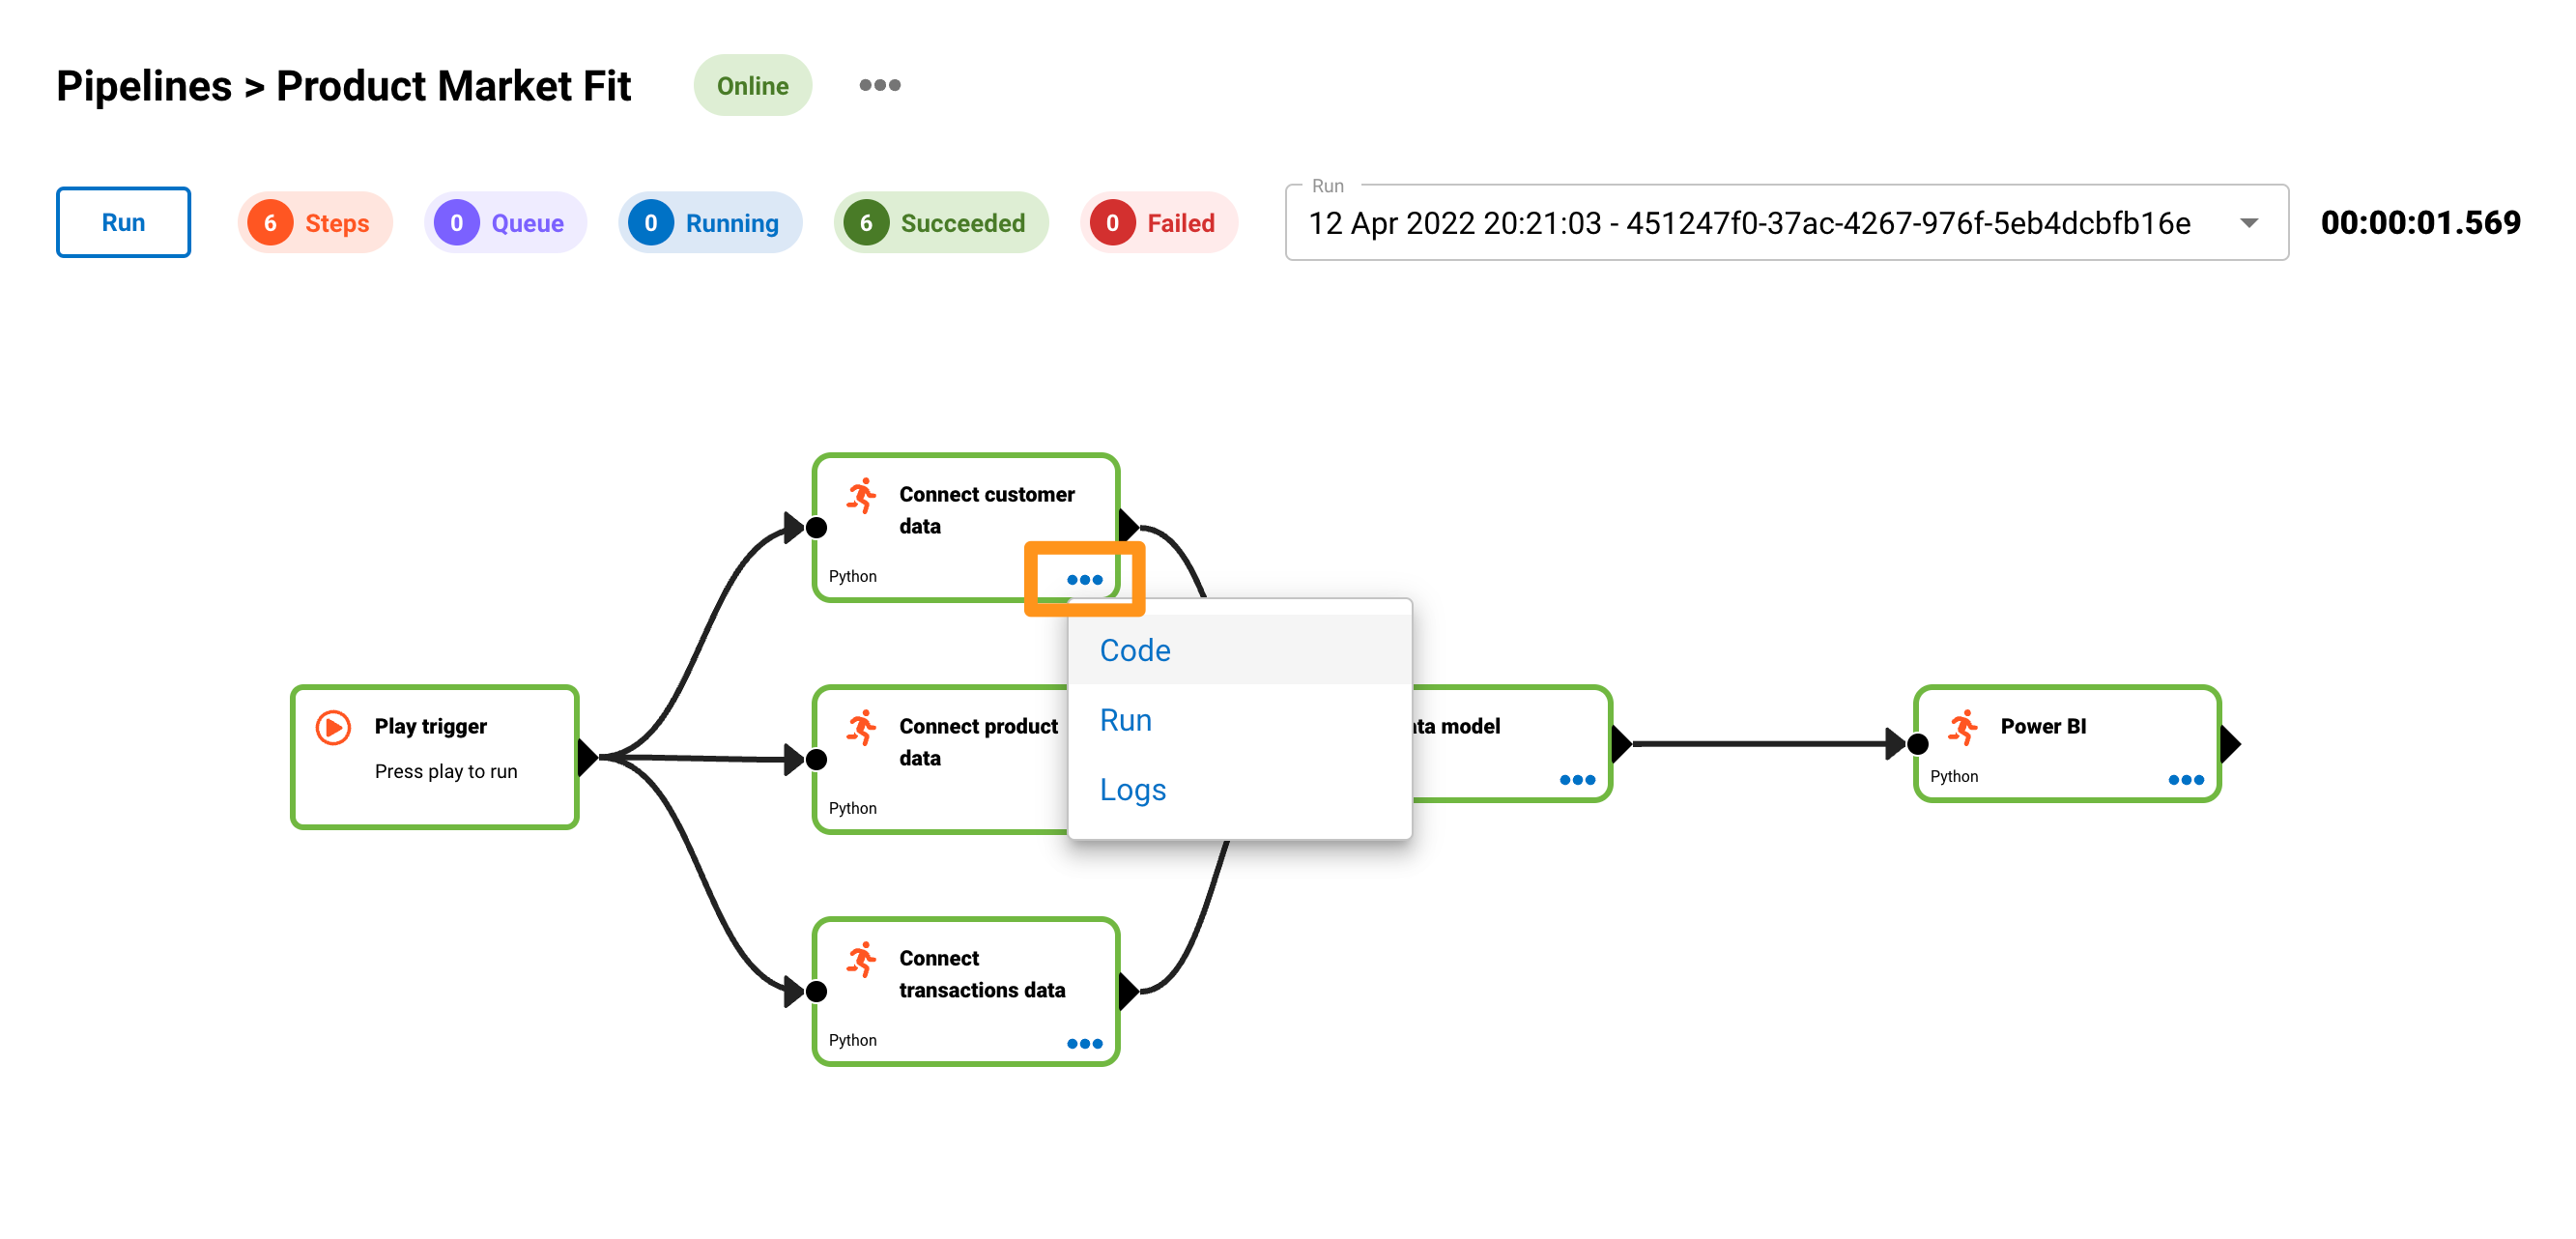
This will open up the code editor for that step in the pipeline.
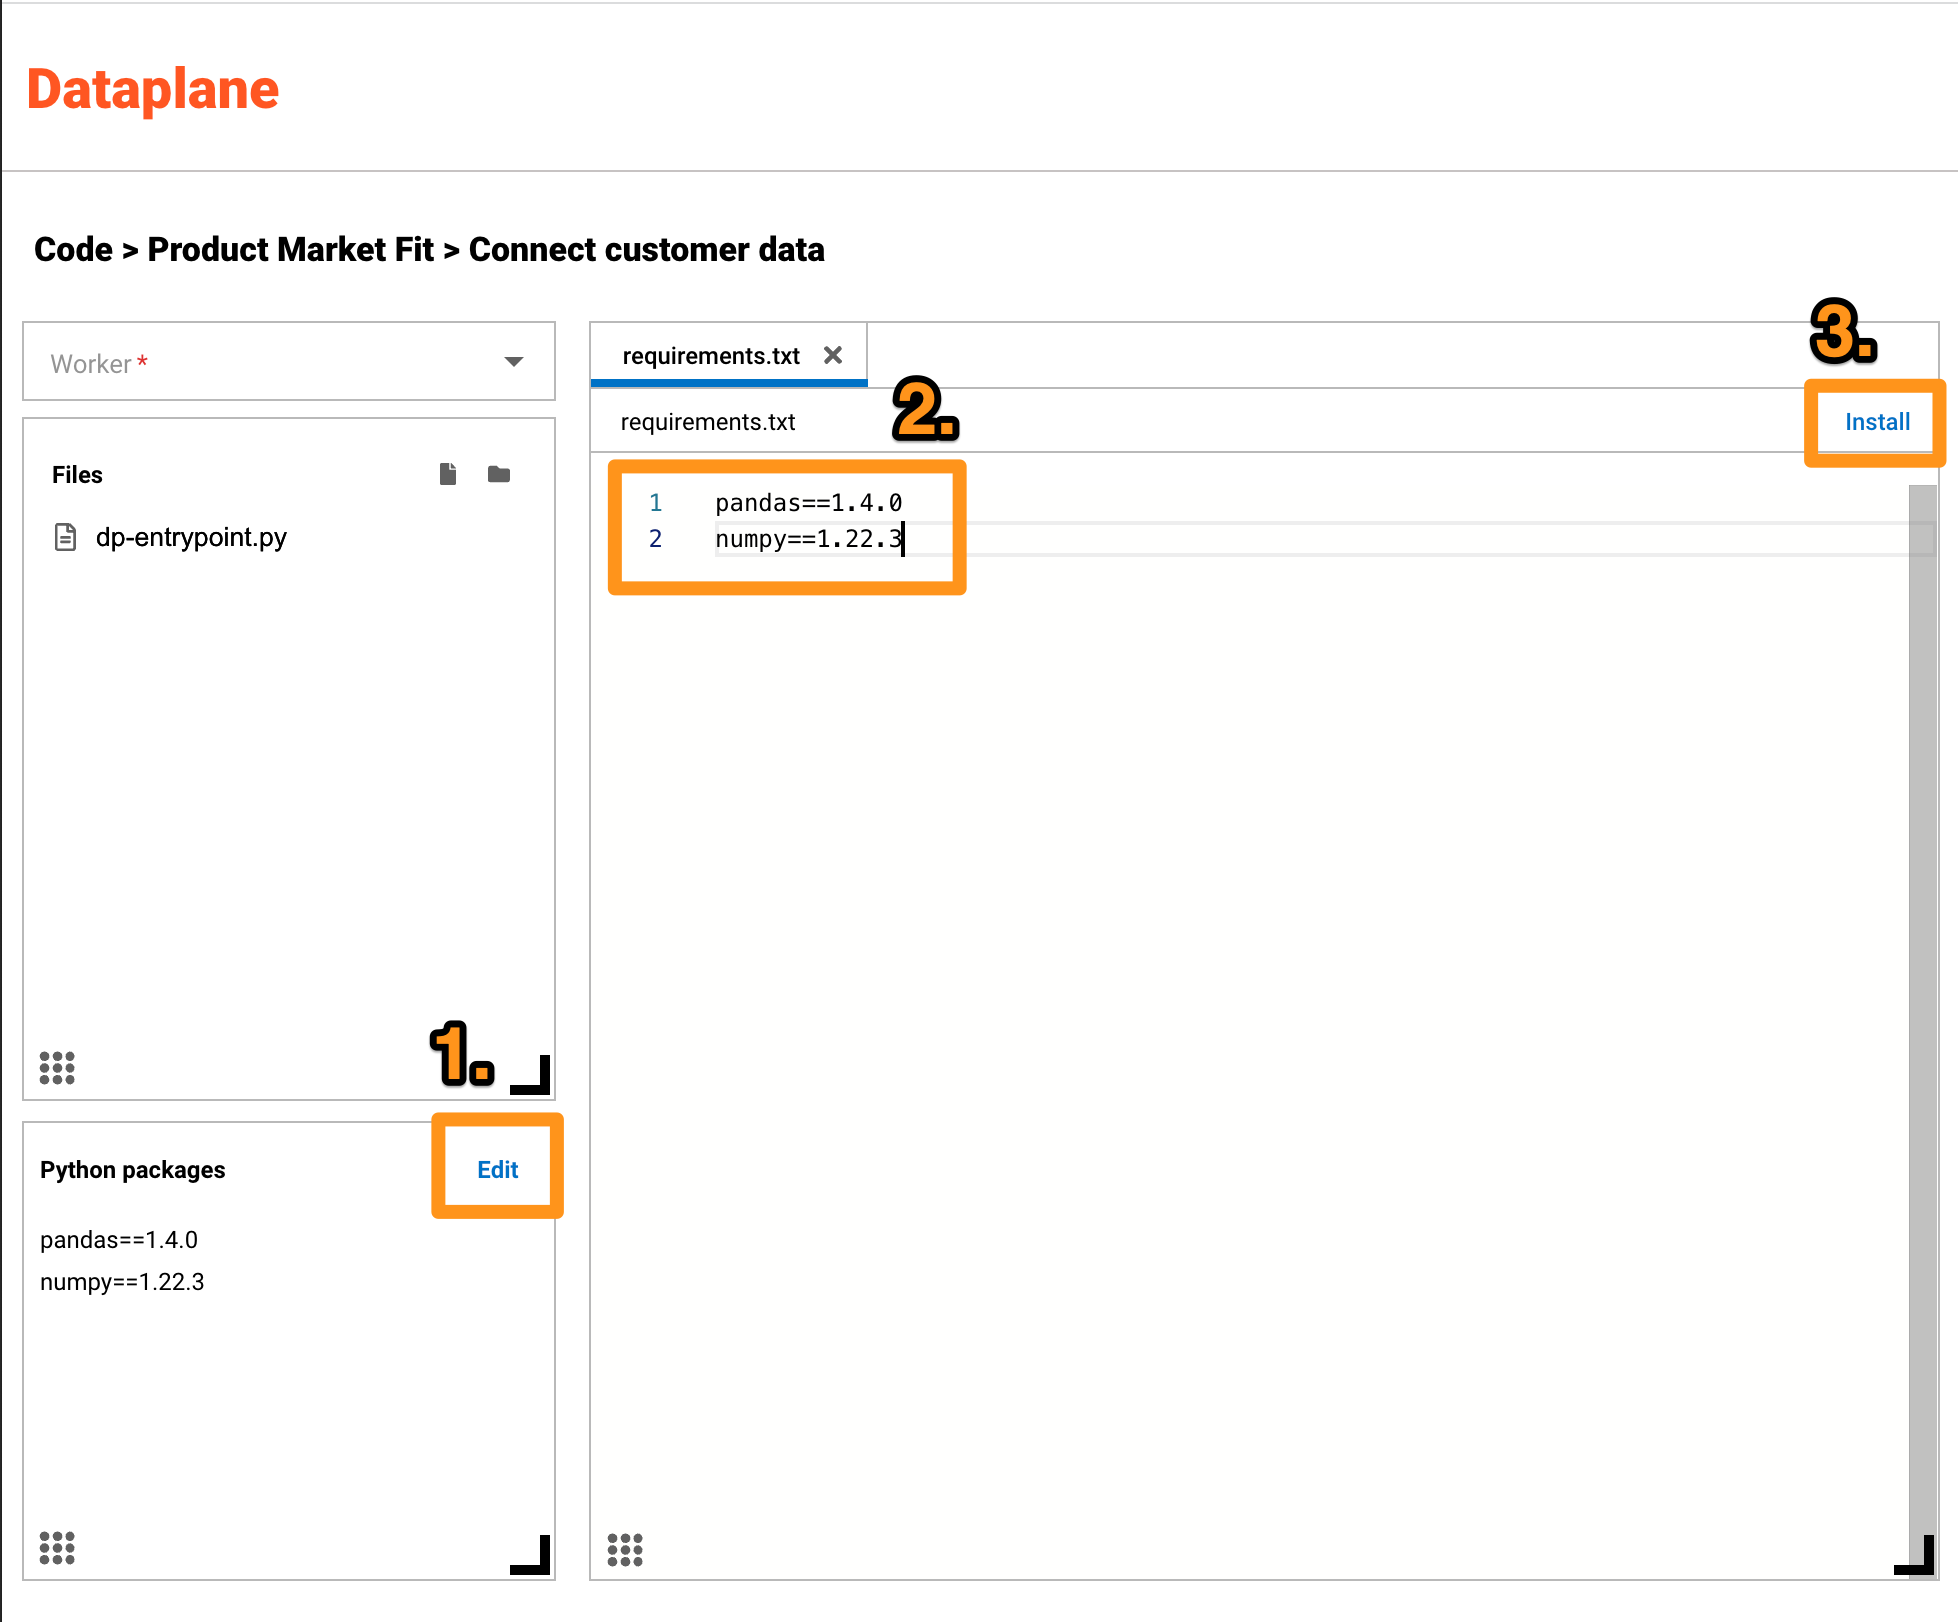
Update Python packages
First, we update the Python pip packages that we need.
- Click Edit in the Python packages section
- Update the packages with these three pip packages
pandas==1.4.0
numpy==1.22.3
dataplane==0.0.5
- Click the Install button
Write and test python code
To add logic or code, we will update the dp-entrypoint.py file. This is the default entry point for the python processor.
- Click on dp-entrypoint.py to open the file
- Add the below test code to dp-entrypoint.py
- Press Save
- Press Run
Your result should look like this.
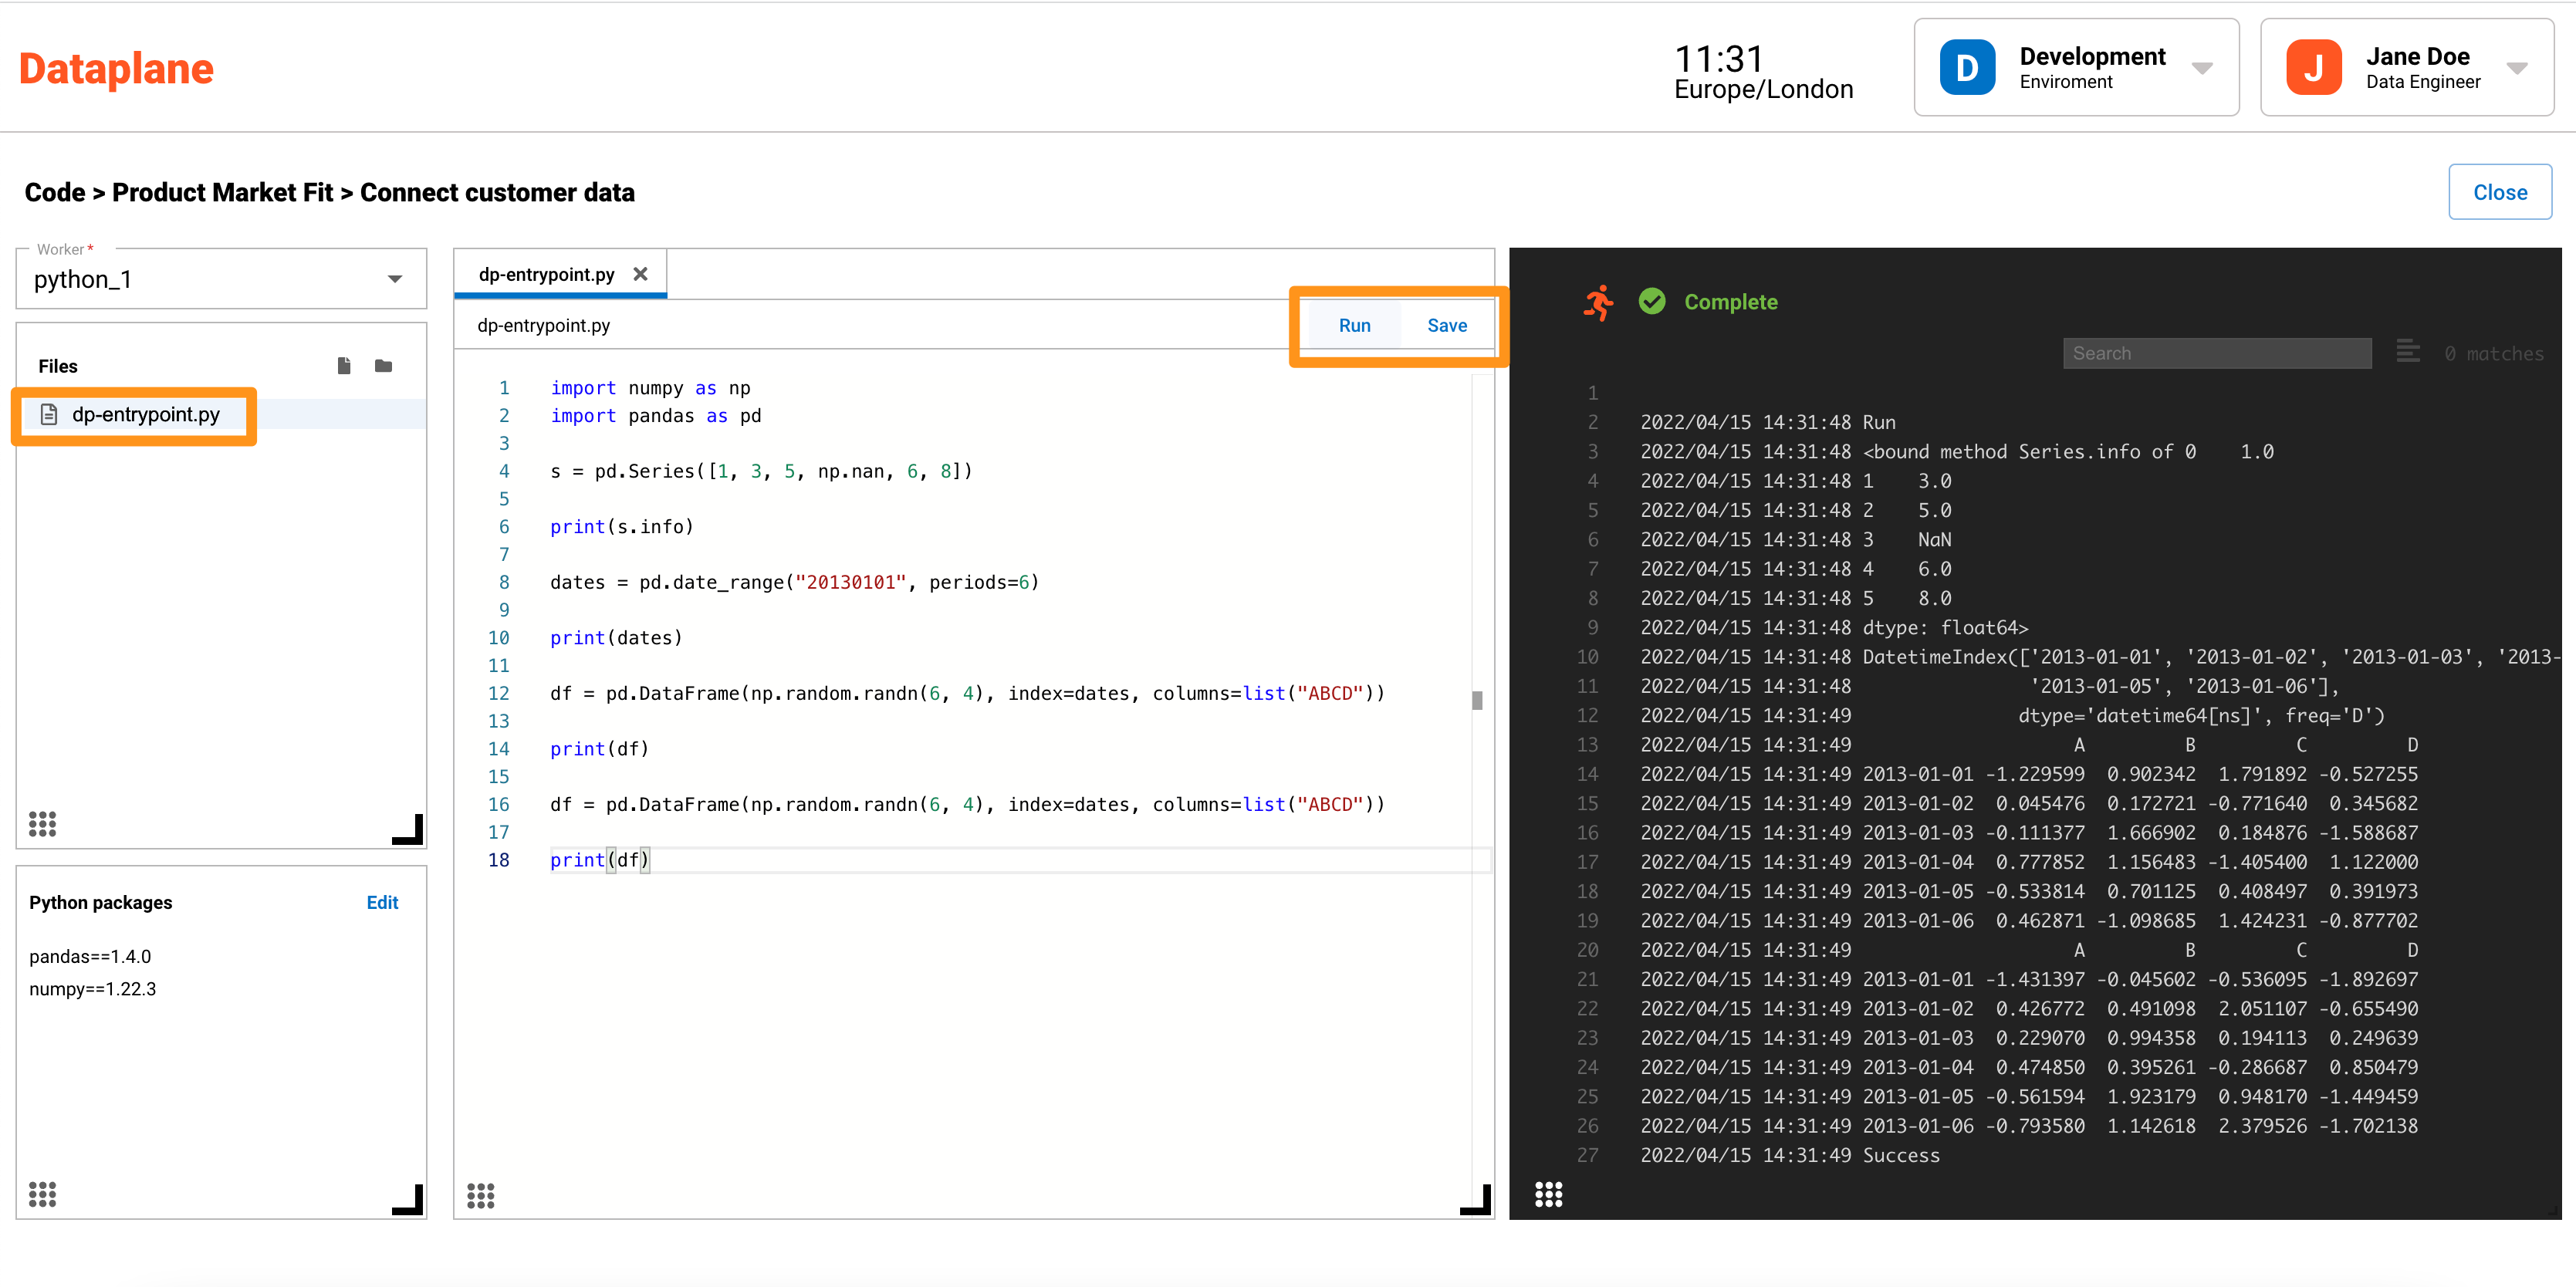
import numpy as np
import pandas as pd
import dataplane

s = pd.Series([1, 3, 5, np.nan, 6, 8])

print(s.info)

dates = pd.date_range("20130101", periods=6)

print(dates)

df = pd.DataFrame(np.random.randn(6, 4), index=dates, columns=list("ABCD"))

print(df)

df = pd.DataFrame(np.random.randn(6, 4), index=dates, columns=list("ABCD"))

print(df)
You can fully replace the code. It is safe to remove any print statements at the top which usually look similar to this:
print("Pipeline id: d81e1c73-b45f-4ff2-81a8-70604606045b")
print("Node id: 2cefb087-dbb6-48bc-91b8-6708ec6e5606")
Run your pipeline
Close the code editor and you will be taken back to the pipeline page.
Press Run.
Congratulations, you have successfully built, tested and run a data pipeline on Dataplane 🎉🎉🎉